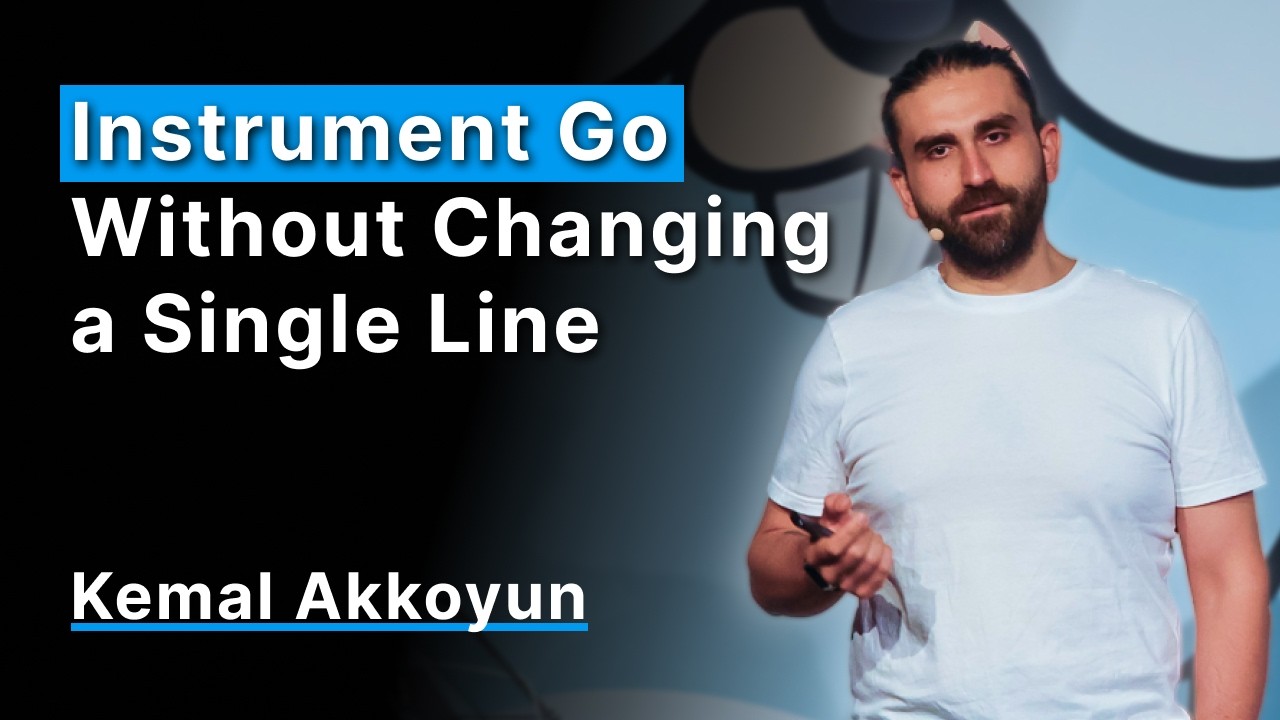
The debugging loop is slow. You cannot reproduce the bug locally, so you add a log line and redeploy. Wrong place. You do it again. An agent alone does not fix this: it still has to pick a mechanism, and it has to know what that mechanism costs.
This talk is about three approaches that take the source edit out of that loop. Each acts at a different point in the software lifecycle, and each inherits the strengths and constraints of its intervention point.
Build time. otelc
rewrites Go code during the build via -toolexec, preserving Go-level semantics
across platforms. The rebuild is the cost.
Process start. An injector loads a shared library at startup via
LD_PRELOAD. No source change, no rebuild. The binary is the constraint. The
Go injector I showed is in development and not released.
Kernel. OBI (OpenTelemetry eBPF Instrumentation) observes running processes from the Linux kernel without rebuilding them. Linux, privileges, and kernel contracts are the cost.
We connect the signals. Tracing follows requests, profiling finds CPU cost,
and the two become much stronger when they share request context. Go cannot use
the native thread-local mechanism directly, so pprof labels become the
bridge.
The OpenTelemetry eBPF Profiler
samples whole-node CPU activity without changing applications, and .gopclntab
survives even fully stripped static binaries.
The talk closes with a decision framework: start with the constraint you cannot change, then add the next layer only when its signal pays for its operational cost.
Recording
Links
- gopherconuk-26 — slides, speaker notes, and research
- zeroins — offline catalog and agent skill toolkit
- opentelemetry-agent-skills — agent skills for instrumenting Go applications
- OpenTelemetry community — SIG calendars, notes, and channels
Events
- GopherCon UK 2026 — Thursday 13 August 2026
Related
- How to Instrument Go Without Changing a Single Line of Code — the six-part written series
- Why Go can’t be monkey-patched (and what people do about it) — part 1
- OBI: eBPF auto-instrumentation for Go in production — part 2
- otelc: zero-touch Go traces at compile time — part 3
- The fourth signal: continuous profiling without code changes — part 4
- Go runtime futures: flight recording, USDT, and the instrumentation hook problem — part 5
- Making zero-touch Go observability agent-actionable — part 6
- Companion posts:
- What a uprobe costs, and what USDT buys — between parts 2 and 3
- See it run: OBI and the eBPF profiler without Kubernetes — after part 4
- Context across goroutines and connections — between parts 4 and 5
- Auto-Instrumenting Go: From eBPF to USDT Probes — full technical blog post expanding on this talk
- Hooking into the Go Toolchain —
-toolexecfrom a stopwatch to otelc, a guest post on Internals for Interns