Zero-touch observability for Go is finally becoming real. In this talk, we walk through the different strategies you can use to instrument Go applications without changing a single line of code, and what they cost you in terms of overhead, stability, and security.
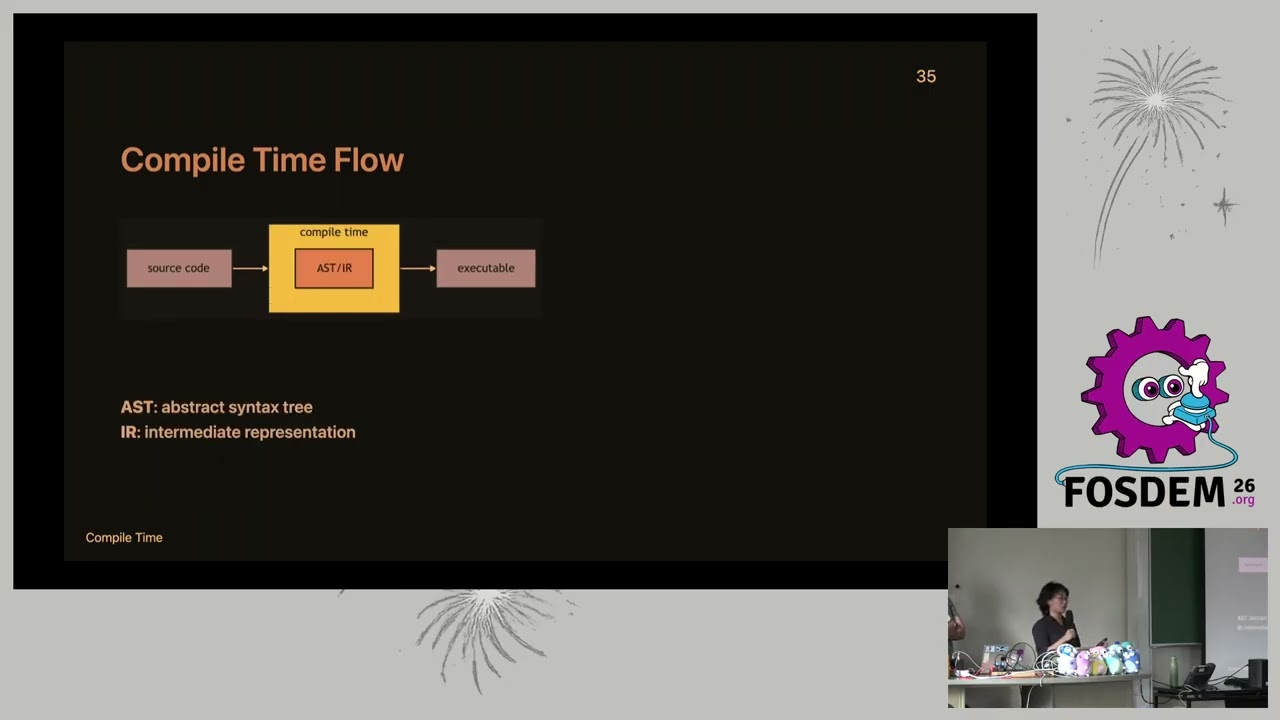
We compare several concrete approaches and projects: eBPF-based auto-instrumentation using OpenTelemetry’s Go auto-instrumentation agent and OBI (OpenTelemetry eBPF Instrumentation), compile-time manipulation using tools like Orchestrion and the OpenTelemetry Compile-Time Instrumentation SIG, runtime injection via Frida/ptrace, and USDT (User Statically-Defined Tracing) probes — both via libstapsdt and a custom Go runtime fork.
Beyond what exists today, we look at how ongoing work in the Go runtime and diagnostics tooling could unlock cleaner, safer hooks for future auto-instrumentation, including the flight recording proposal and an experimental USDT fork of the Go toolchain.
Throughout the talk, we use benchmark results and small, realistic services to compare these strategies along three axes: performance overhead (latency, allocations, CPU impact), robustness and upgradeability across Go versions and container images, and operational friction (rollout complexity, debugging, and failure modes).
Recording
Slides
Demo/Code
Events
Related
- Auto-Instrumenting Go: From eBPF to USDT Probes — full technical blog post expanding on this talk